Rasmus Kristoffer Pedersen
Welcome to my personal website. Here you will find my Curriculum Vitae as well as links to some of my other stuff.
I am currently employed as a scientist ("Wissenschaftlicher Mitarbeiter") at the University of Münster, Germany, where I am part of the Clinical Epidemiology group at Institut für Epidemiologie und Sozialmedizin. Read more about the Clinical Epi group here.
Previously, I work in the PandemiX research group at Roskilde University, Denmark, working on historical epidemiology and COVID-19.
Read more about PandemiX here.
In my Ph.D. I worked with mathematical modelling of MPNs, as part of the Cancitis Research Group.
Read more about Cancitis here.
Link to PDF-version of CV
Quick links for various interactive visualizations:
-
Interactive SIRS-model
Article (in danish)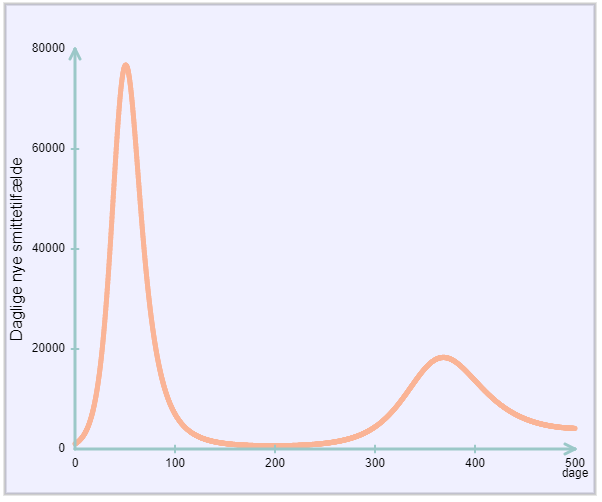
-
Interactive SIR-model
Article (in danish)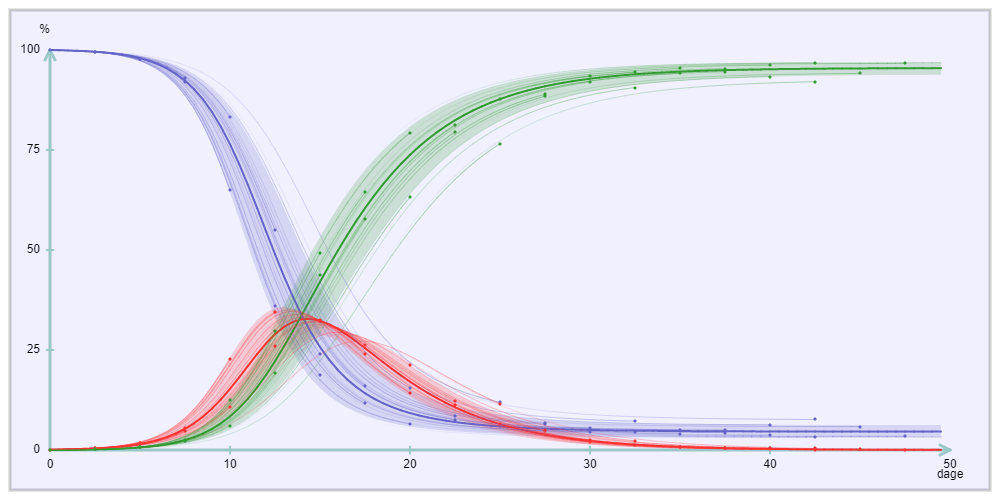
-
-
Interactive COVID-19 alpha variant
Article (in danish)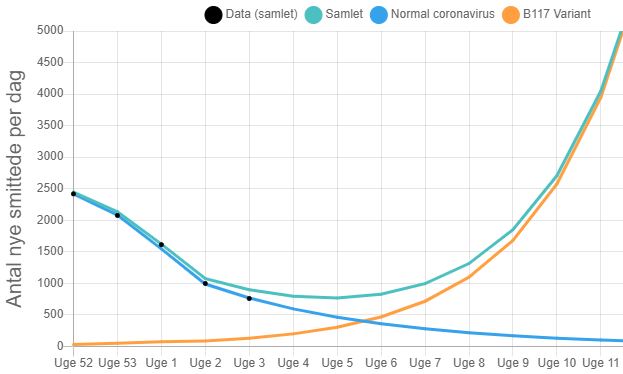
-
Interactive figure of viral load (COVID-19)
-
-
-
Portfolio
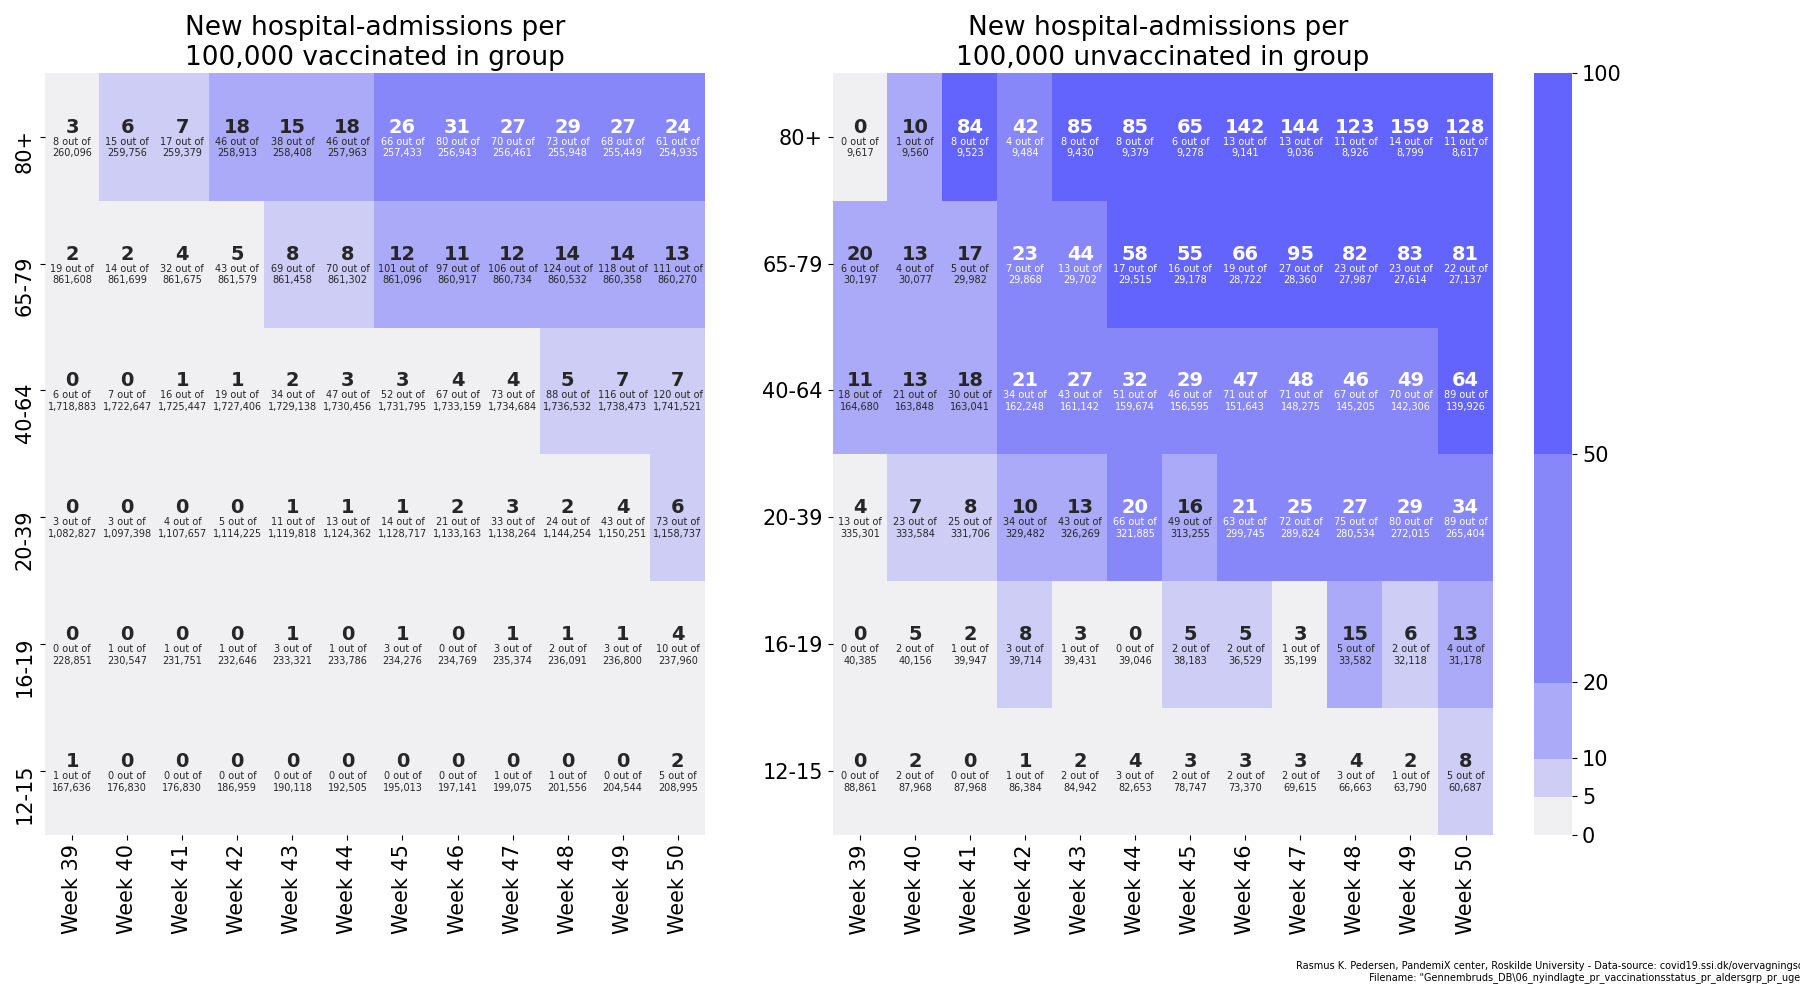
COVID-19 hospitalization-rate for vaccinated individuals
2022
Heatmap comparing the number of new hospitalizations due to COVID-19 in different age-groups, depending on vaccination-status. Shows the number of hospitalizations per 100,000 citizens in each age-group, including the raw numbers. When I made the figure, the public focus was about the number of new hospitalizations, without regard for the size of the corresponding population-group in general (As an example, week 46 had 80 hospitalizations among vaccinated 80+-year old, with "only" 13 among the unvaccinated in same age-group. Relative to the population-groups however, the unvaccinated where three times as likely to be hospitalized).
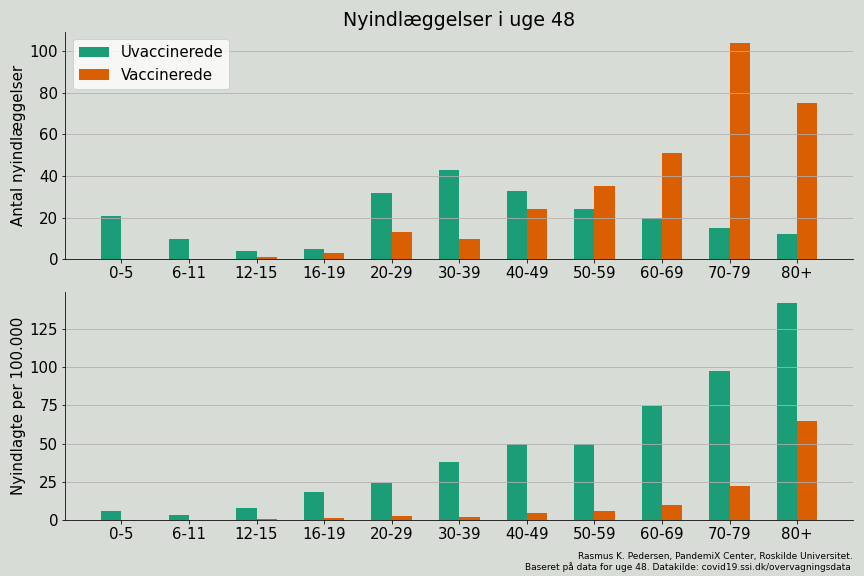
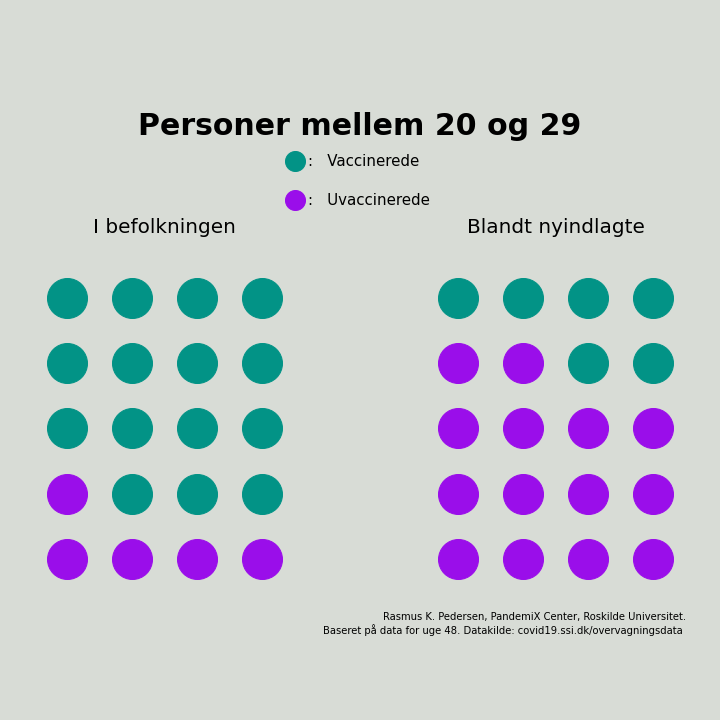
COVID-19 hospitalization-rate, additional figures
2022
Supplementary figure to the heatmap, illustrating the number of new hospitalizations and hospitalizations per 100,000 for a specific week. To illustrate the main point, I also illustrated the proportion of hospitalization of 20-29 year olds as dots representing 5% of the population-group.
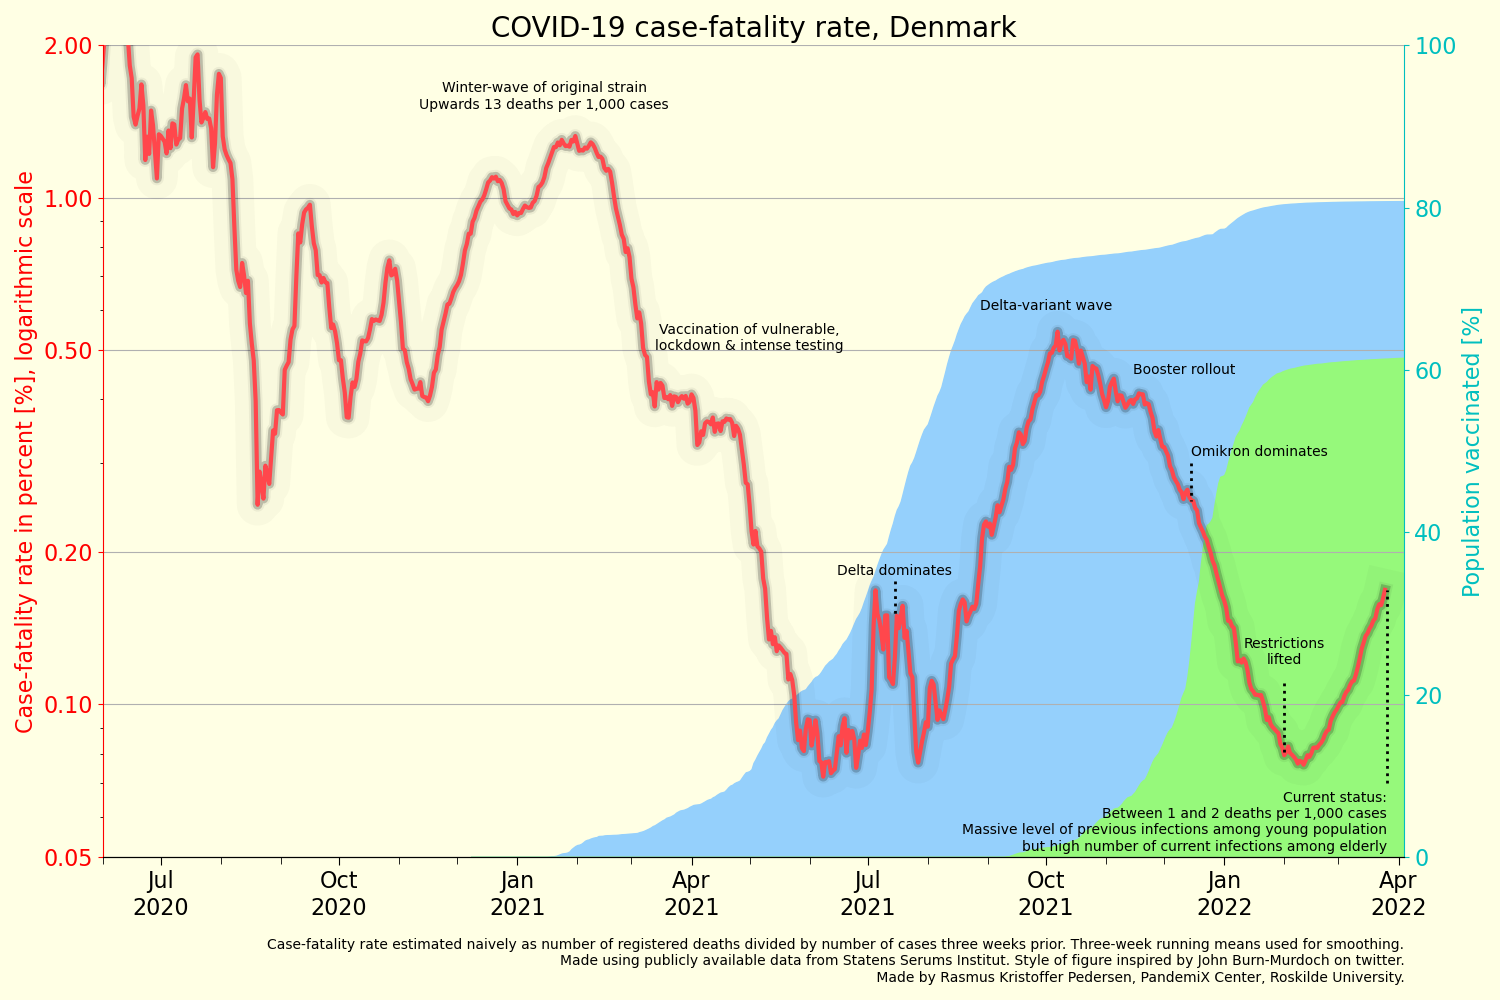
COVID-19 case-fatality ratio
2022
Illustration of the progression of a naive calculation of the COVID-19 case-fatality rate (CFR) for Denmark from the start of the pandemic until April 2022. The figure shows how CFR declines as the vulnerable are vaccinated, increases as the Delta-variant dominates, and then again declines as booster-vaccinations are carried out and the Omicron variant dominates. Inspired by a similar figure for the UK created by John Burn-Murdoch.
Educational material for Danish high schools (Gymnasium)
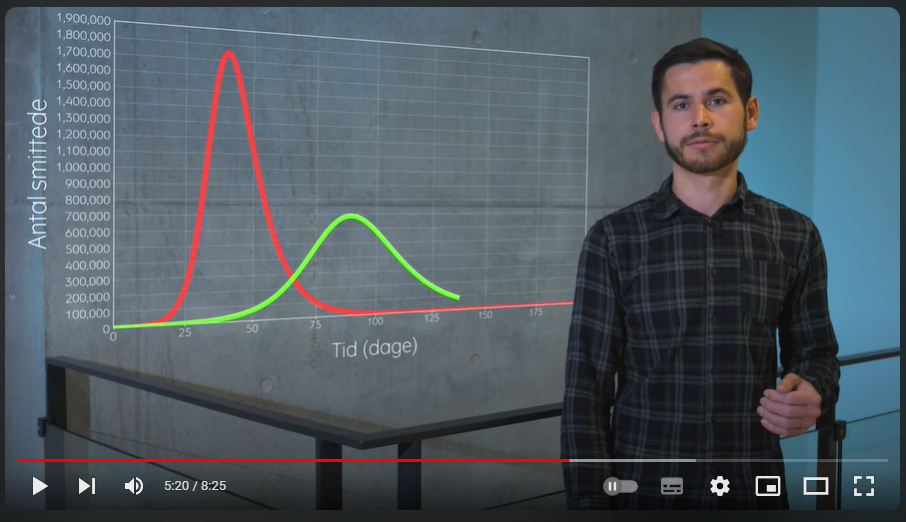
2022
Development of educational material with the purpose of student-recruitment for the educations at Roskilde University, consisting of a short article, a worksheet and a video.
Material available online: https://ruc.dk/undervisningspakke-epidemier-og-matematiske-modeller
Interative figure for "Kapløb med COVID" article
2021
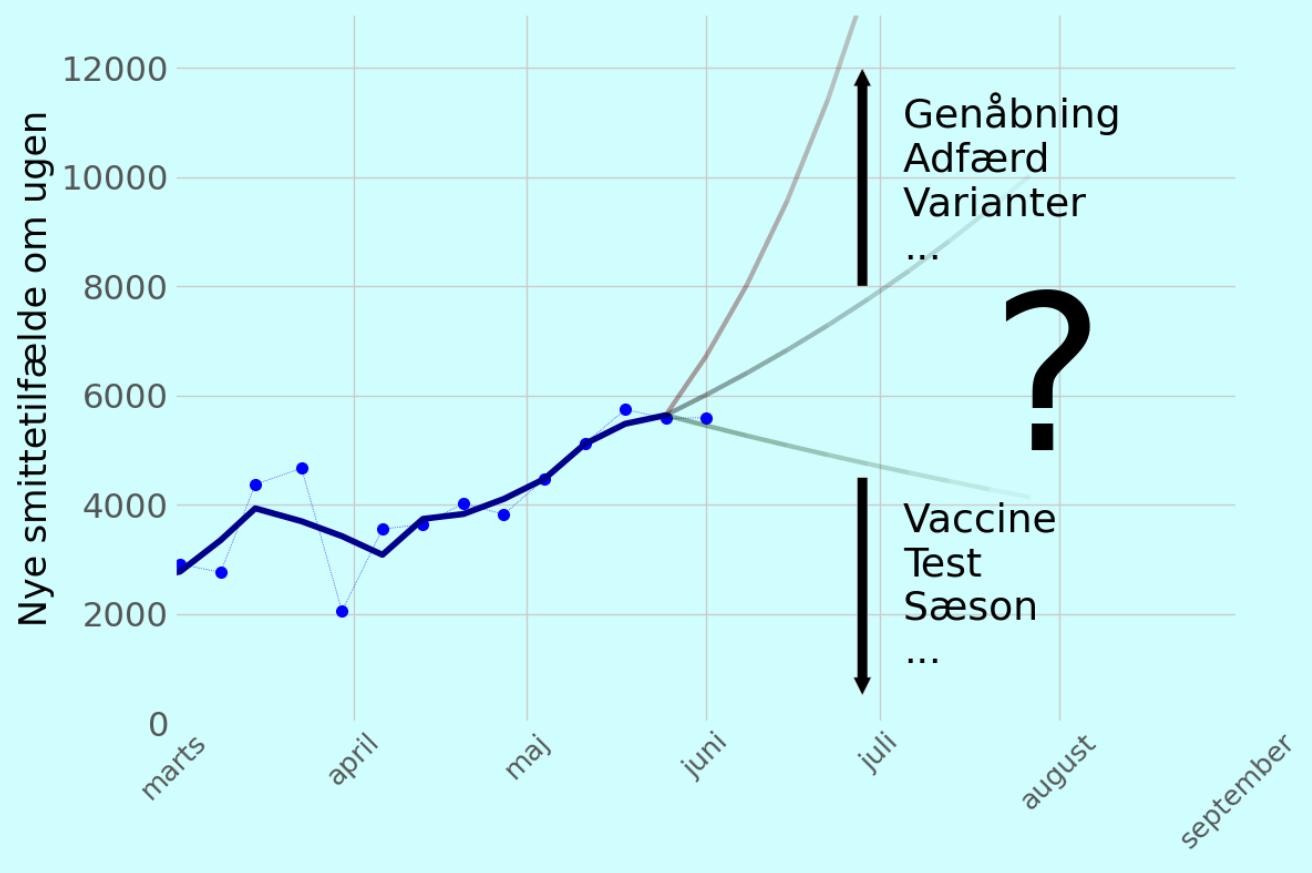
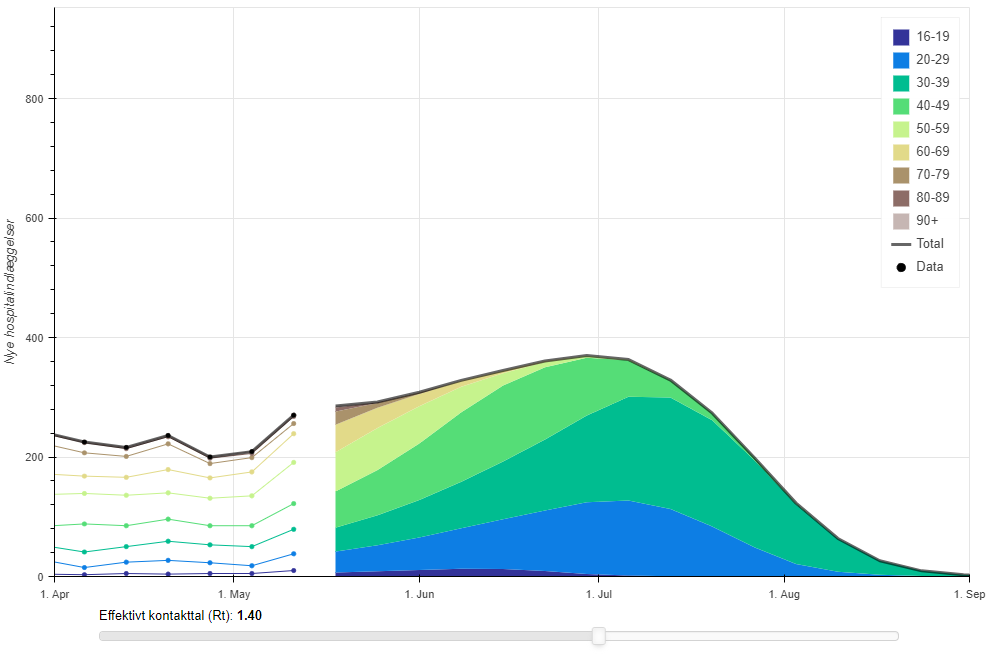
Interactive figures showing model-calculations of the COVID-19 wave in Denmark during the summer of 2021. Increased vaccine-uptake and reduced sociatal infection meant that COVID-19 was dying out. The arrival of the Delta- and Omicron-variants meant that later COVID-19 waves occured at the end of 2021. Developed for (Danish) article on Videnskab.dk: https://videnskab.dk/krop-sundhed/kaploebet-med-covid-19-kan-det-naa-at-gaa-helt-galt-eller-er-vi-allerede-i-maal/
Visualizations available online: Interaktivt/CovidSommer/cases Interaktivt/CovidSommer/hospData
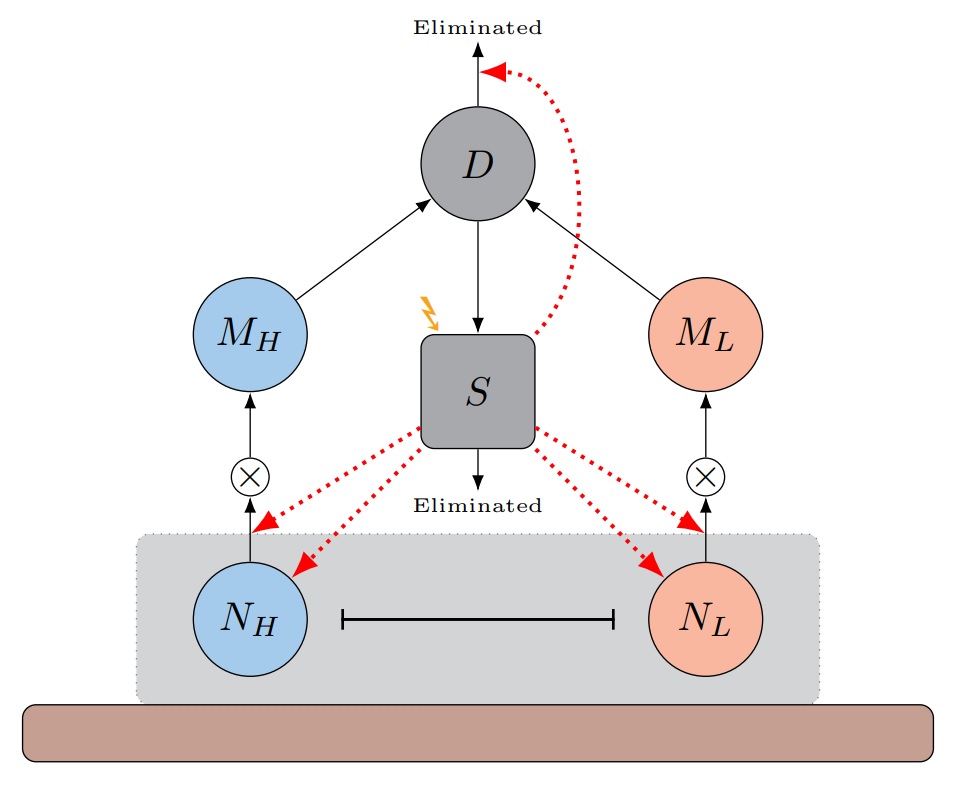
Interactive “Viral load” figure
2021
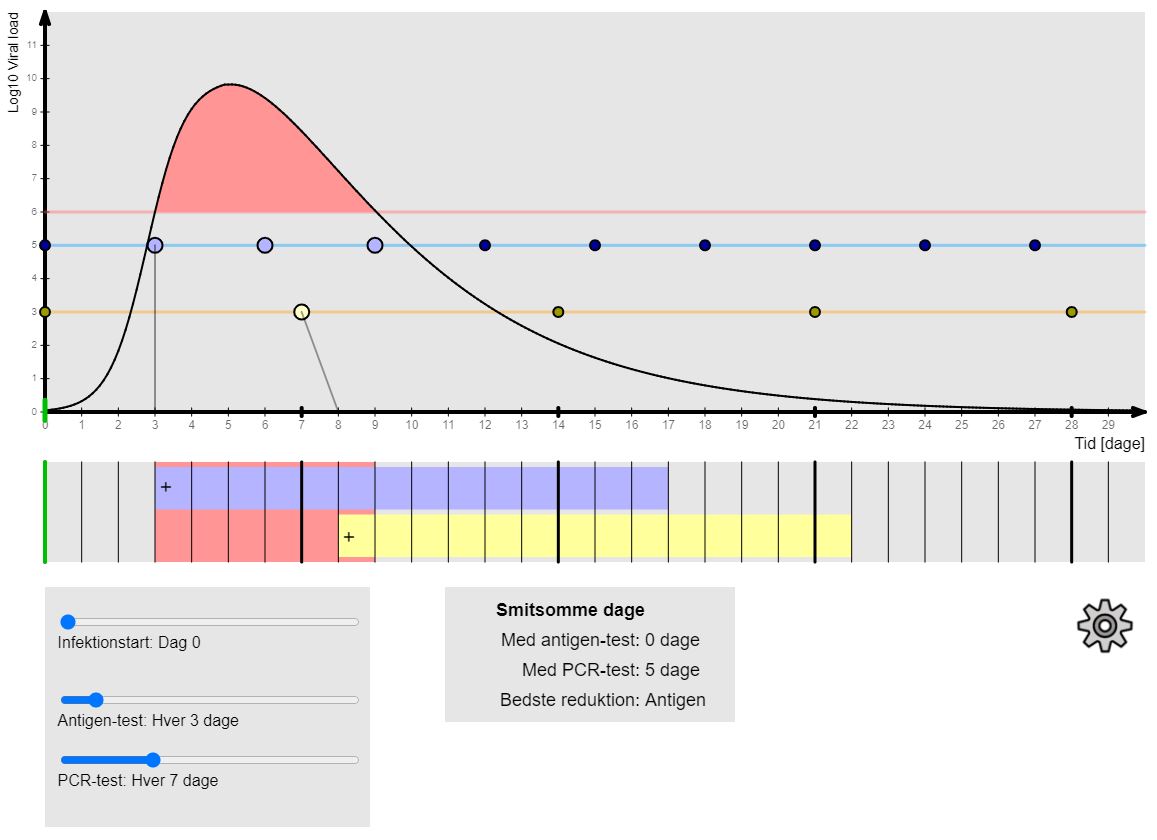
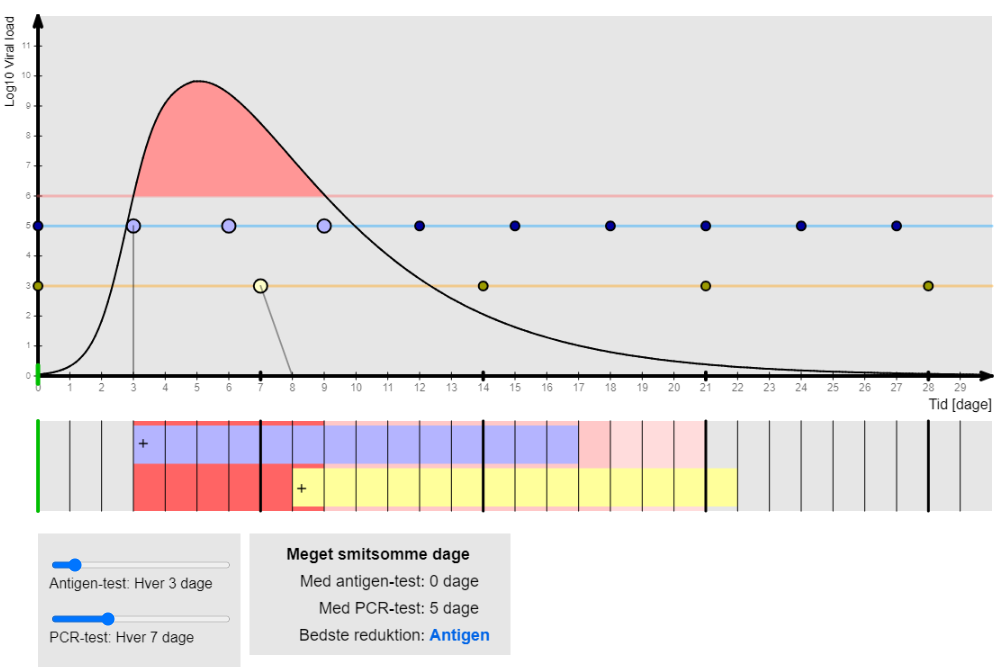
Illustration of the viral load of an individual following a COVID-19 infection, and different testing strategies. The figure illustrates how frequent tests with a less sensitive test (e.g. lateral flow tests) can be better at detecting infections when compared to less frequent tests with a higher sensitivity (e.g. PCR-tests). Developed as part of PandemiX's modelling support of governmental investigation before the roll-out of the massive Danish COVID-19 lateral-flow testing strategy at the beginning of 2021.
Visualization available online: InteractiveViralLoad
Interactive prediction of the arrival of the Alpha-variant
2021
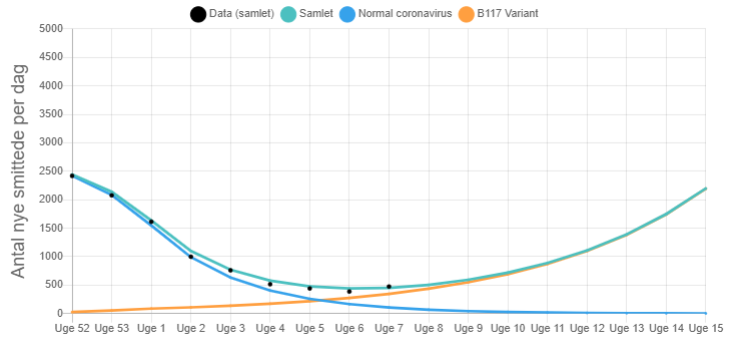
Decreasing COVID-19 infections following Christmas 2020/2021 and the arrival of the B.1.1.7 variant (later named Alpha), meant that, despite decreasing infections, an increase could be expected within a couple of weeks. Prediction made around week 5, and ended up being accurate for the following weeks. Developted for (Danish) article for Videnskab.dk: https://videnskab.dk/naturvidenskab/britisk-variant-lurer-stadig-denne-interaktive-beregner-viser-hvorfor-vi-er-noedt-til-at-holde-fast/
Visualization available online: InteractiveExponential
Interactive SIR-model
2020, 2021, 2022
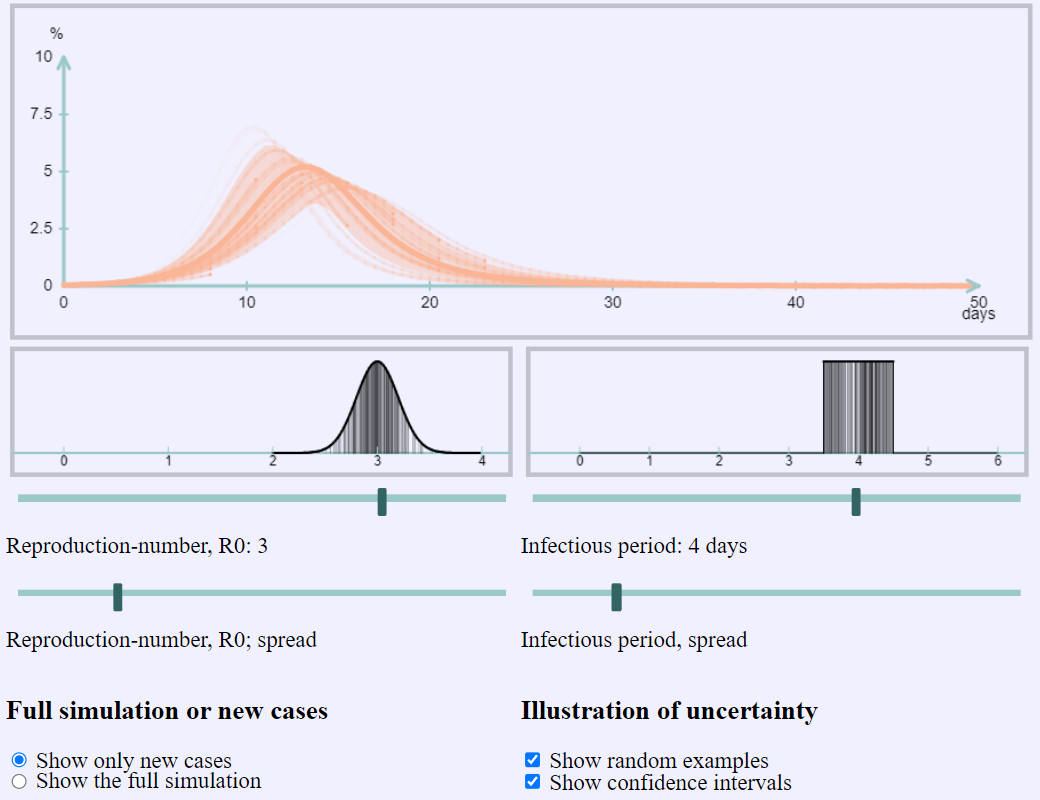
The SIR-model is a classic model within epidemiology, and one of the mathematical arguments behind the COVID-19 lockdown in March 2020.
During the COVID-19 pandemic, I made a number of interactive visualizations of the SIR-model for make it easier for laypersons to get an intuitive understnaindg of how the model works, and the model parameters.
Developed for (Danish) articles for Videnskab.dk:
https://videnskab.dk/krop-sundhed/tilbage-til-begyndelsen-lav-dine-egne-corona-kurver/
https://videnskab.dk/krop-sundhed/vender-covid-19-for-alvor-tilbage/
Visualizations available online:
Interactive/SIR/ and Interactive/SIRS/ and Interactive/SIR_simple/
Interactive SIR-model, agent-based
2016 and 2017
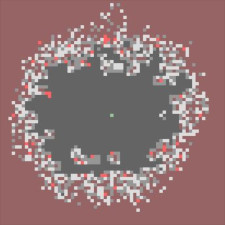
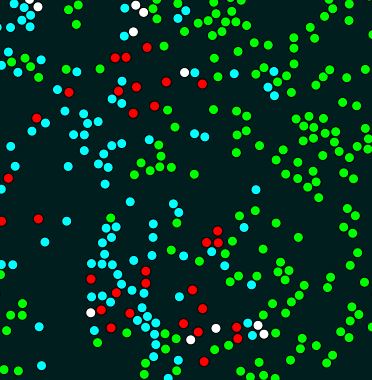
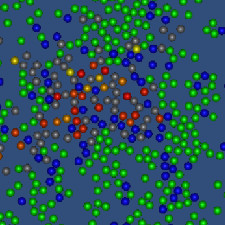
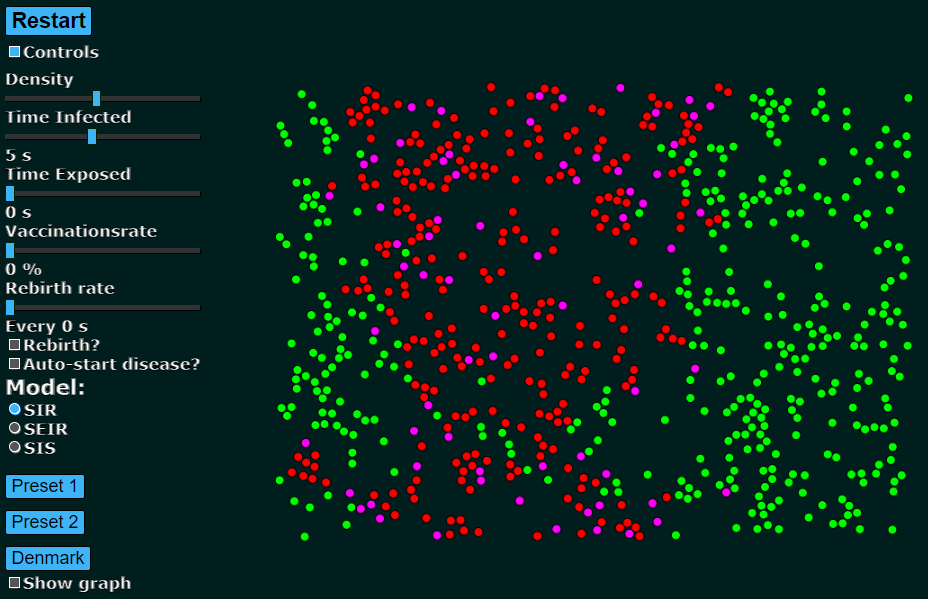
Long before COVID-19 made disease-spread and epidemiology common terms, I worked with mathematical epidemiology as a student. During my education, I was part of the Science Show at Roskilde University, in which we made public dissemination of various student-projets in an effort to attract new student to Roskilde University. For the Science Show presentations, I developed an agent-based visualization of the SIR-model, to illustrate different epidemiological aspects.
Visualizations available online:
SIR
Scientific publications
"A Disease Suppression Strategy in Action: The Impact of Non-Pharmaceutical interventions in the COVID-19 pandemic in Denmark."
Lone Simonsen, Rasmus Kristoffer Pedersen, Viggo Andreasen, Tyra Grove Krause, Eskild Petersen
"Identifying Signature Features of Epidemic Diseases from 19th Century All-cause Mortality Data"
Rasmus K. Pedersen, Mathias M. Ingholt, Maarten van Wijhe, Viggo Andreasen, Lone Simonsen
"Hvordan Matematisk Modellering kan supplere Historien - Mæslinger på Fyn i 1874"
English: "How Mathematical Modelling can Supplement History - Measles on Funen in 1874"
Rasmus K. Pedersen
"COVID-19 mortality attenuated during widespread Omicron transmission, Denmark, 2020 to 2022"
Nikolaj U. Friis, Tomas Martin-Bertelsen, Rasmus K. Pedersen, Jens Nielsen, Tyra G. Krause, Viggo Andreasen, Lasse S. Vestergaard
"Understanding Hematopoietic Stem Cell Dynamics - Insights from Mathematical Modelling"
Rasmus K. Pedersen, Morten Andersen, Thomas Stiehl, Johnny T. Ottesen
"HSC niche dynamics in regeneration, pre-malignancy and cancer: Insights from mathematical modeling"
Rasmus K. Pedersen, Morten Andersen, Vibe Skov, Lasse Kjær, Hans C. Hasselbalch, Johnny T. Ottesen, Thomas Stiehl
"Temperate climate malaria in nineteenth century Denmark"
Mathias Mølbak Ingholt, Tzu Tung Chen, Franziska Hildebrandt, Rasmus K. Pedersen, Lone Simonsen
"Effekten af COVID-19 screening i Danmark"
English: "The effect of COVID-19 screening in Denmark"
Rasmus K. Pedersen, Christian Berrig, Søren Ørskov, Lone Simonsen, Viggo Andreasen
"A novel integrated biomarker index for the assessment of hematological responses in MPNs during treatment with hydroxyurea and interferon-alpha2"
Marc J.B. Dam, Rasmus K. Pedersen, Trine A. Knudsen, Morten Andersen, Christina Ellervik, Morten K. Larsen, Lasse Kjær, Vibe Skov, Hans C. Hasselbalch, Johnny T. Ottesen
"Dose-dependent mathematical modeling of interferon-α-treatment for personalized treatment of myeloproliferative neoplasms"
Rasmus K. Pedersen, Morten Andersen, Trine A. Knudsen, Vibe Skov, Lasse Kjær, Hans C. Hasselbalch, Johnny T. Ottesen
"Mathematical modelling of the hematopoietic stem cell-niche system: Clonal dominance based on stem cell fitness"
Rasmus K. Pedersen, Morten Andersen, Thomas Stiehl, Johnny T. Ottesen
"Data-driven analysis of the kinetics of the JAK2V617F allele burden and blood cell counts during hydroxyurea treatment of patients with polycythemia vera, essential thrombocythemia, and primary myelofibrosis"
Marc J. B. Dam, Rasmus K. Pedersen, Trine A. Knudsen, Morten Andersen, Vibe Skov, Lasse Kjær, Hans C. Hasselbalch, Johnny T. Ottesen
"Mathematical Modeling of MPNs Offers Understanding and Decision Support for Personalized Treatment."
Johnny T. Ottesen, Rasmus K. Pedersen, Marc J. B. Dam, Trine A. Knudsen, Vibe Skov, Lasse Kjær, Morten Andersen
"Data-driven analysis of JAK2V617F kinetics during interferon-alpha2 treatment of patients with polycythemia vera and related neoplasms"
Rasmus K. Pedersen, Morten Andersen, Trine A. Knudsen, Zamra Sajid, Johanne Gudmand-Hoeyer, Marc J. B. Dam, Vibe Skov, Lasse Kjær, Christina Ellervik, Thomas S. Larsen, Dennis Hansen, Niels Pallisgaard, Hans C. Hasselbalch, Johnny T. Ottesen
"Bridging blood cancers and inflammation: The reduced Cancitis model"
Johnny T. Ottesen, Rasmus K. Pedersen, Zamra Sajid, Johanne Gudmand-Hoeyer, Katrine O. Bangsgaard, Vibe Skov, Lasse Kjær, Trine A. Knudsen, Niels Pallisgaard, Hans Carl Hasselbalch, Morten Andersen
"Mathematical Modelling as a Proof of Concept for MPNs as a Human Inflammation Model for Cancer Development"
Morten Andersen, Zamra Sajid, Rasmus K. Pedersen, Johanne Gudmand-Hoeyer, Christina Ellervik, Vibe Skov, Lasse Kjær, Niels Pallisgaard, Torben A. Kruse, Mads Thomassen, Jesper Troelsen, Hans Carl Hasselbalch, Johnny T. Ottesen
Presentations, posters and more
"Identifying Signature Features of Epidemic Diseases in 19th Century All-cause Mortality Data"
Contributed Talk
"How to visualize your science"
Invited presentation
"Model-based approach for determining COVID-19 incidence for different testing intensities"
Contributed Talk
"Mathematical Modelling of Myeloproliferative Neoplasms and Hematopoietic Stem Cells"
Contributed Talk
"Modelling Hematopoietic Stem Cells and their Interaction with the Bone Marrow Micro-Environment."
Contributed Talk (Cancelled due to Corona-Virus)
"Modelling Hematopoietic Stem Cells and their Interaction with the Bone Marrow Micro-Environment."
Online talk given for "Statistics and Biomathematics Seminar"
"Modelling hematopoietic stem cells and their interaction with the bone marrow micro-environment."
Contributed Talk
"Modelling hematopoietic stem cells and their interaction with the bone marrow micro-environment."
Talk at "Stem Cell Modelling Day"
"Modelling the Dynamics of Hematopoietic Stem Cells"
Poster at "SIAM Conference on Applications of Dynamical Systems"
"Modelling of Quiescent Stem Cells in Relation to Myeloproliferative Neoplasms"
Poster at "European Conference on Mathematical and Theoretical Biology"
Additional science-communication
During the COVID-19 pandemic I wrote and co-wrote a number of science-communication-articles, for the broad public, published at danish science-news website videnskab.dk. For a complete list, see here.
"Communicating Mathematics with Interactive Visualizations"
Talk at Studiensfonds Community Conference, Bielefeld, Germany
"Communicating Science and Mathematics with Interactive Visualizations"
Talk at DataViz CPH meetup
"Interaktive Visualiseringer til Videnskabelig Formidling - Hvordan matematiske modeller gøres forståelige ved hjælp af interaktive simuleringer"
VIDEO LINK
IDA webinar (In danish)
"Communicating Science with p5.js - How interactive simulations and creative coding can make the complex relatable"
Talk at "Processing Community Day 2020"
"The benefits of building and working with interactive simulations - Interactive simulations for better model intuition"
Blog post for "Mathematical Oncology" blog
Education
PhD - Mathematical modelling of myeloproliferative neoplasms
Master of science in mathematics and physics
Bachelor-degree in mathematics and physics
HTX
Physics A-level / Mathematics A-level
Experience
PostDoc at Institute of Epidemiology and Social Medicine
PostDoc at PandemiX research center
Research assistant at Department of Science and Environment
PostDoc at PandemiX research center
Course teacher - "Modelling Populations and Epidemics"
Course teacher - "Mathematical modelling and dynamic systems"
Teaching assistant - BK2: "Experimental Methods"
Teaching assistant - Calculus
Teaching assistant - BK1: "Empirical Data"
Developer and active part of Science Show
Full-time substitute mathematics teacher
Competencies
IT-Competencies
- Python - Much experience
- MATLAB - Much experience
- LaTeX - Much experience
- Java - Some experience
- C# - Some experience
- Microsoft Excel - Much experience
- General web development (HTML, Javascript, CSS) - Enough to make this website
Language
- Danish - C2, Native language
- English - C2
- German - B1
Volunteer work
- Member of the chairmanship - Tutoring 2014 Roskilde University
- Tutor for natural science - Tutoring 2013 Roskilde University
- Tutor for humanities - Tutoring 2012 Roskilde University
